Today I’m going to discuss why I think that Natural Gas futures are set to breakout in the intermediate term and resume their longer term trend higher. After a volatile start to 2014, we have seen some basing in natural gas above an important level and the recent price action is suggesting that the risk/reward at current levels favors the upside over the next 3-6 months.
The first chart we are looking at is a 10 year weekly bar chart to put things in a longer term in perspective.

As you can see in this 10 year bar chart of natural gas futures, we have been in a sustained downtrend after an aggressive move higher in ’08 and breakdown through support at nearly $6. Over the past five years we have put in a bottoming process, an inverse head and shoulders pattern, with a neckline around 4.50 Also, we can see we are back at trend line support from the ’12 low and are also supported by the longer term moving averages.

In this 5 year weekly bar chart we can clearly see the late 2009 back-test of the broken support at $6 and the resumption of the downtrend to low ’12 low. We are now back testing the neckline of the inverse head and shoulders bottom pattern and trend line support. Support is clearly defined in the range below depending on your time frame.
Another perspective is a three year daily line chart. Here we can see price in a clearly defined uptrend channel. Price is now basing above the 150 day, the bottom of the channel working off the supply of the early 2014 false breakout, and ready to fill the gap and head higher toward the top of the channel and long term resistance. Momentum is moving improving as well with RSI holding above 50 and rounding out to the upside.

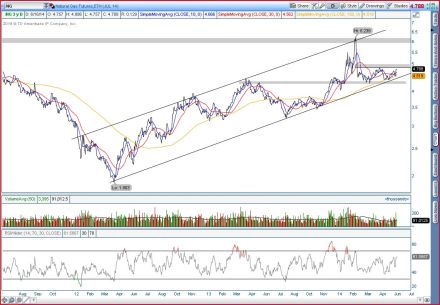
This one year candlestick chart shows that aggressive breakout early in 2014 up towards long term resistance and finally a breakdown back to support to allow the longer term moving averages and support levels to confirm. Now we are forming an ascending triangle against the gap up to $5. This basing above ~4.25 support allowed us to work off the overhead supply created by the false breakout and create the conditions needed for a more sustainable price move to develop.

Here in the CoT data we can see that since early ’14 we are seeing large speculators increase their net short positions and through the CoT move index we can see that despite increased selling pressure from large speculators price managed to hold support and is working on moving towards the top of its recent range. Although the positioning of market participant’s is a little unclear at this point in time, I think if we see some momentum develop to the upside, large speculators may be caught off guard as they seem to be miss-positioned for a move higher.

To look at natural gas in terms of relative strength we will use a ratio measured by UNG/USO, two etfs that track the price of natural gas futures and WTI crude futures respectively. We can see that since early 2012, we have been putting in a bottoming process, starting by breaking the long term downtrend line that has been in place since early ’09. Since then, we have steadily been making progress towards moving higher and are now at the top of our recent range. This improvement, although slow and steady, suggests that natural gas prices still have room to go higher relative to the prices of crude oil.
Below is a summary of the main points of my thesis:
1. Longer term bottoming pattern (inverse head and shoulders) remains intact as long as price holds above neckline support.
2. Support is clearly defined below on all time frames. Whether you have a micro, intermediate, or macro time-frame, the current risk/reward scenario favors the upside if you place your stops correctly according to your own investment/trading plan.
3. Commitment of Traders data shows that large speculators may be miss-positioned as they are increasing their net short positions and price action continues to improve, despite their increased selling pressure.
4. Relative strength has plenty of room to improve despite the “large”, in absolute terms, move off the low in natural gas prices. Natural gas continues to be the cheaper energy source relative to crude oil.
As a result of the above observations, I believe that Natural Gas is looking to head higher toward that 6.00 long term resistance area. Trend line support since around $4.45, and longer term support sits around $4.25 depending on your time frame. Ideally we want to see this trend line support and 150 day SMA hold and provide momentum for a break to the upside of this short term ascending triangle. If this sideways action continues and we break through trend line support we may just need more time to base before heading higher. I will be wrong for sure if we break and close below $4.25 on volume.
