Good Risk/Reward in Casino Stocks

After getting extended in late 2013 and pulling back to start 2014, some of the casino stocks seem to be setting up well against support for a trade on the long side. To focus on the sector we’ll be using an etf, BJK, as a proxy and then focus on two stocks within the sector that are showing relative strength and weakness. Those stocks are MGM and CZR respectively.

This weekly chart of BJK shows that the sector has been in an uptrend since mid 2012 but got extended, as many other momentum sectors did, in late 2013. After some initial weakness in 2014, we are now back at trend line support as momentum tries to dig in and base at current levels. Risk/Reward is good here as you know you will be wrong with a close below these support levels at 47.50. It may need some more time to base, but definitely a sector to have on your radar.
This daily chart of BJK tells the same story as we attempt to base above this level and allow the shorter term moving averages to flatten and provide support below. In addition, momentum has not been making new lows with price, a positive divergence to make note of.

Continue reading

Natural Gas Setting Up For Higher Prices

Today I’m going to discuss why I think that Natural Gas futures are set to breakout in the intermediate term and resume their longer term trend higher. After a volatile start to 2014, we have seen some basing in natural gas above an important level and the recent price action is suggesting that the risk/reward at current levels favors the upside over the next 3-6 months.

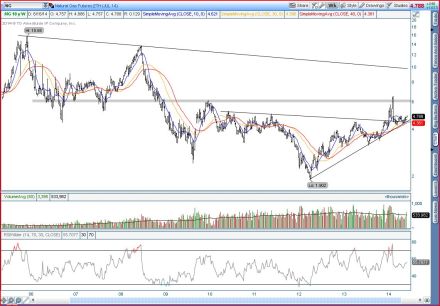
The first chart we are looking at is a 10 year weekly bar chart to put things in a longer term in perspective.

Natural Gas Weekly

As you can see in this 10 year bar chart of natural gas futures, we have been in a sustained downtrend after an aggressive move higher in ’08 and breakdown through support at nearly $6. Over the past five years we have put in a bottoming process, an inverse head and shoulders pattern, with a neckline around 4.50 Also, we can see we are back at trend line support from the ’12 low and are also supported by the longer term moving averages.

Continue reading